Data Storytelling Report
: Analysis on the Market, Trends, and TechnologiesThe data storytelling market is consolidating into a discipline that pairs automated narrative engines with targeted visual experiences, supported by $2.45B in total funding and 1,240 active companies driving product and services activity. This funding base sits alongside 767 published articles and 410 funding rounds that signal steady investor interest even as company- and patent-growth categories register mixed signals. Practically, three forces determine winners: (1) systems that translate anomalies into prescriptive recommendations rather than descriptive dashboards, (2) conversational and generative interfaces that let nontechnical users query and receive narrative insight, and (3) highly interactive outputs (video, microsites, immersive visuals) that measurably increase stakeholder engagement and retention.
We updated this report 203 days ago. Noticed something’s off? Let’s make it right together — reach out!
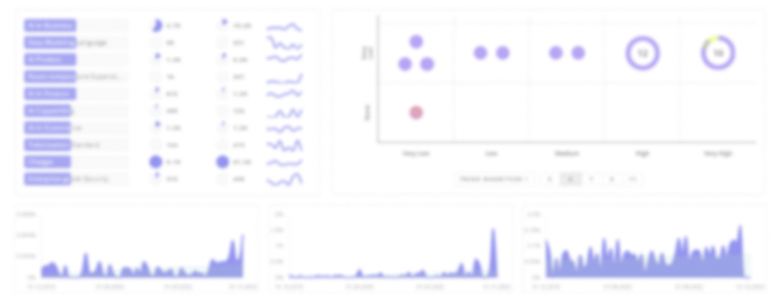
Topic Dominance Index of Data Storytelling
The Topic Dominance Index trendline combines the share of voice distributions of Data Storytelling from 3 data sources: published articles, founded companies, and global search
Key Activities and Applications
- Automated Narrative Generation (NLG & LLM integration) — Platforms generate human-readable explanations of KPI changes, surface anomalies, and draft executive summaries to reduce analyst time-to-insight; vendors such as RIGHTSENSE INC and ANDRE exemplify this automation trend by converting raw inputs into full reports and chat-driven narratives.
- Conversational Data Access — Natural-language query interfaces and chat-style workflows let business users ask plain-English questions and receive context-aware explanations, lowering reliance on SQL and dashboards; DvSum and Datawisp are notable implementations of conversational discovery DvSum.
- No-Code / Low-Code Visual Canvases — Visual builders and template libraries enable marketers and product teams to assemble narrative assets (interactive charts, microsites, data collection canvases) without engineering effort; Storycards and Flourish (Canva) target this use case for fast content cycles Storycards.
- Decision Intelligence and Prescriptive Actions — Advanced systems map the most impactful variables to recommended next steps rather than only reporting what changed; Diwo positions this as "decisions, not dashboards," delivering prioritized recommendations to business users Diwo.
- Immersive and Domain-Specific Storytelling — AR/3D visualizations and verticalized narratives (real estate, esports, civic reporting) turn high-context datasets into persuasive experiences—Flow Immersive and HUDstats provide domain-optimized immersive outputs and real-time story feeds HUDstats.
- Training and Data Literacy Programs — Firms delivering workshops, curricula, and coaching remain high-value because tool availability alone does not guarantee effective narratives; storytelling with data and Data Literacy Academy focus on skill adoption rather than only software storytelling with data.
Emergent Trends and Core Insights
- Generative AI as a Production Multiplier — AI assists chart selection, narrative draft creation, and voiceover scripts, shrinking production cycles and increasing content throughput; market studies report rising AI adoption and forecast expanding AI-captured share in storytelling toolchains Canva – Data Storytelling Report.
- Video-First and Interactive Formats Increase Recall — Video and interactive microsites now represent a major portion of consumption channels, producing higher engagement and recall metrics versus static slides; industry surveys show 42% of data stories delivered as video and 36% consumed via interactive microsites in marketing contexts Venngage – Data Storytelling Marketing Benchmark Report 2021.
- Shift from visualization tool spend to platform outcomes — Organizations redirect budget share from standalone charting licenses toward platforms that combine analysis, narrative automation, and distribution because 42% of visualization budgets are already tool licences and buyers want integrated outcomes rather than point tools Statista – Data Storytelling as a Strategic Asset (PDF).
- Data quality and observability become gating factors — As firms automate narratives, the cost of poor inputs rises; internal reporting shows the topic emphasizes investments in observability and governance before narrative automation succeeds.
- Verticalization commands premium monetization — Products that deliver ready-to-use narratives for specific industries (real estate, esports, municipal reporting) capture higher adoption rates and measurable ROI because they reduce custom integration and storytelling effort.
Technologies and Methodologies
- Large Language Models (LLMs) and Natural Language Generation (NLG) — LLMs power contextual explanations, automated executive summaries, and chat interfaces that translate data anomalies into explanatory text; patent activity and vendor products increasingly pair LLM outputs with structured data insights.
- Augmented Analytics and Automated Insight Prioritization — Systems apply ML to rank and prioritize findings so the narrative backbone highlights statistically significant or business-impactful facts first; this is core to platforms that aim to produce prescriptive recommendations.
- Interactive Web and Microsite Builders — Tools that publish self-guided exploration experiences (filters, story steps, embedded narratives) enable deeper stakeholder exploration and longer engagement times MarketResearchFuture - Data Visualization Applications Market.
- Data Observability and Cataloging Layers — Metadata, lineage, and quality checks are embedded into story pipelines so narratives attach clear provenance and trust signals before distribution; this underpins enterprise adoption and regulatory compliance.
- Immersive Visualization Engines (AR/3D/Spatial) — Spatial and multi-dimensional renderers let teams inspect complex relationships and support collaborative decision sessions; vendors like Flow Immersive and Immersion Analytics are building these capabilities into executive workflows Immersion Analytics.
- Storyboarding Frameworks and Narrative Templates — Formal templates (situation-problem-recommendation flows, decision playbooks) are codified into platforms to standardize outcome framing and speed deployment across business units.
Data Storytelling Funding
A total of 133 Data Storytelling companies have received funding.
Overall, Data Storytelling companies have raised $2.4B.
Companies within the Data Storytelling domain have secured capital from 418 funding rounds.
The chart shows the funding trendline of Data Storytelling companies over the last 5 years
Data Storytelling Companies
- RIGHTSENSE INC — RIGHTSENSE INC automates KPI monitoring and produces chat-integrated data stories that detect outliers and deliver role-specific alerts, positioning itself as an analyst-in-a-chatbox for frontline teams; the vendor emphasizes historical plus external signals (weather, foot traffic) to produce timely, business-relevant narratives.
- ANDRE — ANDRE converts raw datasets, especially survey results, into full narrative reports with charts and slide drafts, lowering friction for teams that need quick conclusions without analyst time; its workflow targets repeatable reporting cycles and rapid adoption by nontechnical users.
- Storycards — Storycards offers a no-code visual canvas for building interactive data collection products and narrative assets, combining AI components with enterprise templates to engage audiences at scale; the company's product focus is rapid content creation for marketing and product teams with measurable engagement metrics.
- Flow Immersive — Flow Immersive blends AR and spatial visualization to create executive-level, immersive data experiences that stakeholders can explore collaboratively; by moving beyond flat dashboards, the company targets high-stakes decision sessions where spatial relationships and interactivity materially change comprehension.
- Storied Data Inc. — Storied Data Inc. packages reports, presentations, and dashboards into portable, interactive InfoApps so organizations can publish data narratives at scale without backend overhead; the product is aimed at teams that need consistent, embeddable narrative outputs across channels.
Gain a better understanding of 1.3K companies that drive Data Storytelling, how mature and well-funded these companies are.
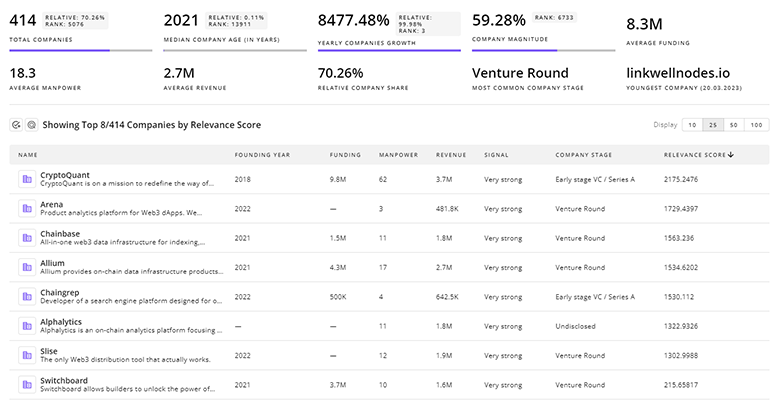
1.3K Data Storytelling Companies
Discover Data Storytelling Companies, their Funding, Manpower, Revenues, Stages, and much more
Data Storytelling Investors
Gain insights into 465 Data Storytelling investors and investment deals. TrendFeedr’s investors tool presents an overview of investment trends and activities, helping create better investment strategies and partnerships.
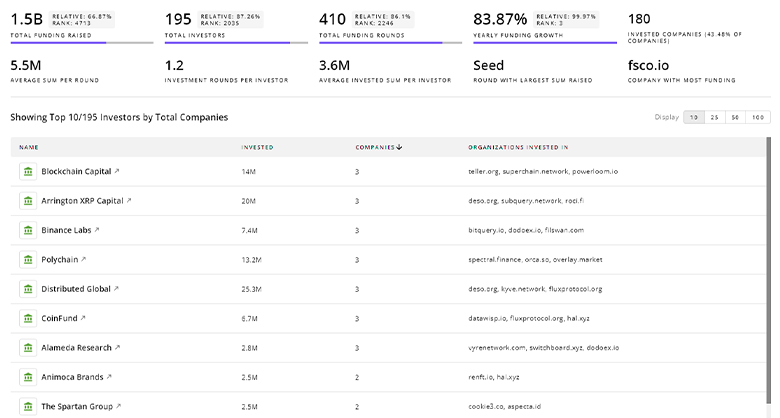
465 Data Storytelling Investors
Discover Data Storytelling Investors, Funding Rounds, Invested Amounts, and Funding Growth
Data Storytelling News
Gain a competitive advantage with access to 846 Data Storytelling articles with TrendFeedr's News feature. The tool offers an extensive database of articles covering recent trends and past events in Data Storytelling. This enables innovators and market leaders to make well-informed fact-based decisions.
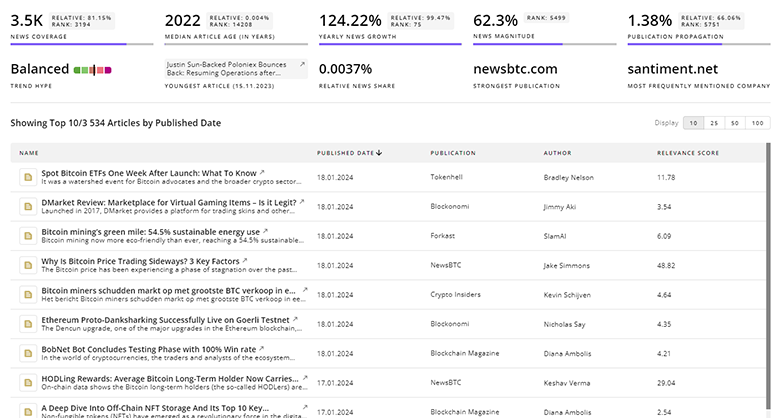
846 Data Storytelling News Articles
Discover Latest Data Storytelling Articles, News Magnitude, Publication Propagation, Yearly Growth, and Strongest Publications
Executive Summary
Data storytelling now sits at the intersection of analysis, communication, and product distribution. Investment patterns and company activity show that the highest returns come from tools that do three things well: produce trustworthy, provenance-linked narratives; convert findings into prescriptive next steps; and deliver those stories in formats matched to audience behavior (chat, video, microsite, or immersive experience). Firms that treat storytelling as an operational capability—backed by data observability, domain templates, and conversational interfaces—will shorten decision cycles and measurably raise stakeholder adoption. Organizations that continue to separate analysis from narrative risk leaving value unrealized while competitors institutionalize narrative pipelines as a part of everyday workflows.
We seek partnerships with industry experts to deliver actionable insights into trends and tech. Interested? Let us know!