Shared Mobility Report
: Analysis on the Market, Trends, and TechnologiesThe shared mobility market sits at a pivotal scaling inflection: 2024 market size: $303,200,000,000, with a 16.8% CAGR in the near term and a projected market value of $768,100,000,000 by 2030. Public policy for low-emission transport, accelerating electrification of fleets and concentrated investment into platform orchestration are driving faster monetization of multimodal services, but operational fragility persists where cities lack integrated data standards and charging infrastructure, creating clear windows for specialist operators and data-layer aggregators to capture durable value marketresearchfuture – Shared Mobility Market, 2025.
200 days ago, we last updated this report. Notice something that’s not right? Let’s fix it together.
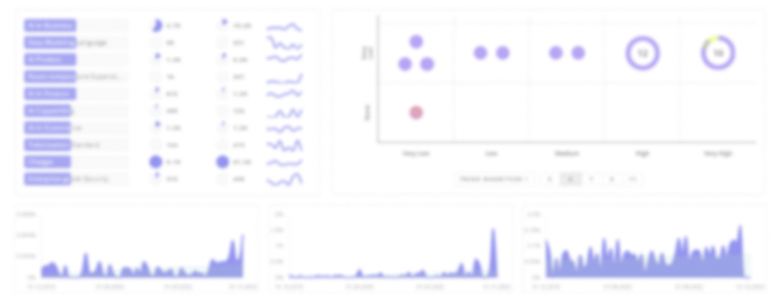
Topic Dominance Index of Shared Mobility
To gauge the influence of Shared Mobility within the technological landscape, the Dominance Index analyzes trends from published articles, newly established companies, and global search activity
Key Activities and Applications
- Demand-Responsive Transit (DRT) & Paratransit management — On-demand routing and dynamic scheduling to serve low-density corridors and passengers with accessibility needs; platforms use AI to convert sparse demand into cost-manageable operations.
- Corporate Mobility (C-MaaS) — Employer-managed mobility budgets, digitally routed commuter shuttles and pooled fleets that shift employer spend from car allowances to shared services, enabling measurable emissions reporting and employee access management flexigo.
- Micromobility for First/Last-Mile — Docked and dockless e-bikes and e-scooters targeted at transit connectivity and short urban trips; operational models include managed fleets, franchise partnerships and battery-swapping networks NABSA.
- Peer-to-Peer (P2P) Asset Utilization — Enabling private asset owners to monetize idle vehicles (cars, accessible vans, charging points) through app-driven access and insurance wrappers for trust and safety Drive lah.
- Logistics and Urban Delivery via Cargo Bikes and Micro-vehicles — Electrified cargo bikes and micro-vehicles used for last-mile delivery to reduce cost per delivery in dense urban cores while aligning with low-emission policies.
- Mobility Data & Operations SaaS — Fleet orchestration, predictive maintenance and real-time dispatch that reduce dead miles and raise utilization; white-label SaaS providers enable operators to launch services without heavy brand investment goUrban.
Emergent Trends and Core Insights
- Electrified micromobility is taking operational precedence. Cities and operators prioritize e-bikes and e-scooters to secure first/last-mile ridership and emissions savings, often pairing deployment with charging or battery-swap networks.
- Vertical specialization creates defensive moats. Providers focused on accessibility, paratransit and regulated public-sector contracts capture higher retention and less price competition than generic consumer ride apps, because certification, trained staff and compliance form structural barriers CoMotion Mobility Solutions.
- Data interoperability is a commercial choke-point. A lack of standard, city-level data feeds forces repeated integration work for aggregators; non-profit and standards bodies that normalize feeds become critical intermediaries for scale MobilityData.
- Corporate MaaS adoption rises because of ESG measurement. Employers choose integrated mobility stacks that provide auditable carbon reductions, making the market a predictable B2B growth channel when verified savings are required for corporate reporting.
- Consolidation of micromobility operators plus hardware integration. Recent M&A and consolidation indicate that scale now requires owning or tightly integrating vehicle hardware, telematics and operations to protect margins marketresearch – Micromobility Boom and Bust, 2024.
- Rural and peri-urban coverage remains under-served. Demand-responsive routing and localized fleets can economically fill gaps if platforms can maintain low marginal cost per trip, which requires efficient pooling algorithms and public subsidies in sparse markets.
Technologies and Methodologies
- AI-powered demand orchestration and dynamic pricing — Predictive demand, incentivized rebalancing and surge controls that lift utilization and compress idle fleet ratios Spare.
- IoT telematics and remote diagnostics — Real-time asset health and location telemetry for micro and macro fleets to reduce downtime and extend asset lifecycles.
- Swappable battery and charging-as-a-service models — Operational continuity solutions that decouple vehicle availability from grid constraints, especially for micromobility and light commercial EVs.
- Standards-based open data feeds and SDKs — GBFS-like feeds and Mobility Data Specifications that permit multimodal trip planning and permit cities to regulate service footprints while enabling aggregator apps.
- Cloud-native SaaS orchestration and white-label stacks — Modular platforms that provide fleet control, payments, and operator dashboards, enabling rapid market entry for enterprise and municipal customers.
- Autonomous shuttles and supervised AV pilots — Limited deployments for campus, first/last-mile and healthcare-access routes where fixed corridors and low speeds reduce complexity.
Shared Mobility Funding
A total of 377 Shared Mobility companies have received funding.
Overall, Shared Mobility companies have raised $35.6B.
Companies within the Shared Mobility domain have secured capital from 1.7K funding rounds.
The chart shows the funding trendline of Shared Mobility companies over the last 5 years
Shared Mobility Companies
- Padam Mobility — Padam Mobility provides an AI-driven DRT and paratransit suite that targets peri-urban and low-demand public transport gaps; its modules include booking interfaces, driver navigation, operator dashboards and a simulation tool for service design. The company focuses on regulatory-ready deployments and public authority contracts, which supports predictable revenue and long-term service agreements. Padam Mobility was acquired by a major transport systems company, consolidating its position for large municipal rollouts.
- Moovmo — Moovmo offers an on-demand ride service specifically for wheelchair accessible vehicles, connecting operators and riders who require accessible transport; this vertical focus addresses a high-stickiness segment with under-supplied capacity. With a very small team, Moovmo pursues a mission-led model that requires operational know-how and trust-building in medical and social service channels.
- YoYo Mobility — YoYo Mobility builds an agnostic corporate travel platform that integrates multiple mobility providers into a single employee mobility experience, enabling employer mobility budgets and routing. The company emphasizes AI-driven supplier selection and cross-supplier reconciliation, making it attractive to medium and large employers seeking carbon accounting for commuting.
- TRIBBU — TRIBBU focuses on recurring commuter carpooling, aiming to make daily sharing as habitual and reliable as public transit through community engagement and predictable route matching. The model targets dense commute corridors and employer ecosystems where repeatability reduces customer acquisition costs and improves fill rates compared with generic ride-hailing.
- VAIMOO — VAIMOO supplies a modular e-bike sharing system (vehicles, docks, management platform) that blends docked and free-floating operations and integrates with city transit systems, prioritizing stability and integration over purely asset-light approaches. Its deployment in multiple European cities validates the benefits of hardware plus software control for operator economics.
Get detailed analytics and profiles on 1.2K companies driving change in Shared Mobility, enabling you to make informed strategic decisions.
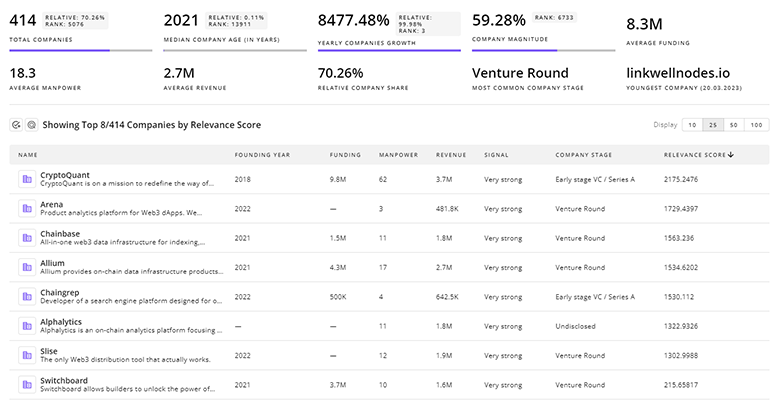
1.2K Shared Mobility Companies
Discover Shared Mobility Companies, their Funding, Manpower, Revenues, Stages, and much more
Shared Mobility Investors
TrendFeedr’s Investors tool provides an extensive overview of 2.2K Shared Mobility investors and their activities. By analyzing funding rounds and market trends, this tool equips you with the knowledge to make strategic investment decisions in the Shared Mobility sector.
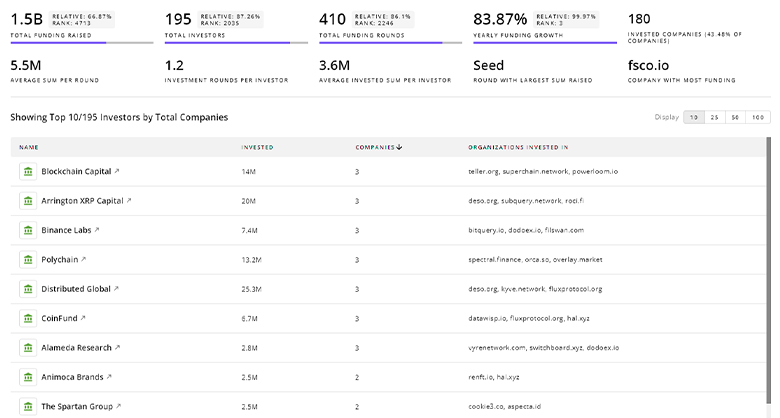
2.2K Shared Mobility Investors
Discover Shared Mobility Investors, Funding Rounds, Invested Amounts, and Funding Growth
Shared Mobility News
Explore the evolution and current state of Shared Mobility with TrendFeedr’s News feature. Access 3.2K Shared Mobility articles that provide comprehensive insights into market trends and technological advancements.
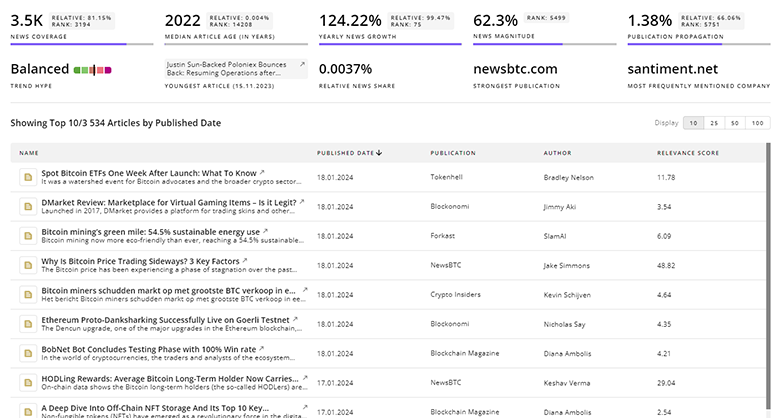
3.2K Shared Mobility News Articles
Discover Latest Shared Mobility Articles, News Magnitude, Publication Propagation, Yearly Growth, and Strongest Publications
Executive Summary
Shared mobility is entering a phase where specialization and control of integration points, rather than sheer geographic scale, determine commercial durability. Firms that combine regulated service expertise (especially in accessibility and paratransit), rigorous fleet telematics and AI orchestration, plus participation in standardized data ecosystems will be able to raise utilization and protect margins. Municipal partnerships and employer contracts provide predictable demand pathways, while electrification and charging strategies determine total cost of service. Investors and operators should prioritize capital allocation to three vectors: specialized service verticals with regulatory lock-in, platform layers that reduce integration friction across cities, and operational hardware/energy solutions that reduce downtime and unit economics risk.
We're looking to collaborate with knowledgeable insiders to enhance our analysis of trends and tech. Join us!